

Solutions and Applications
PV INSPECTOR
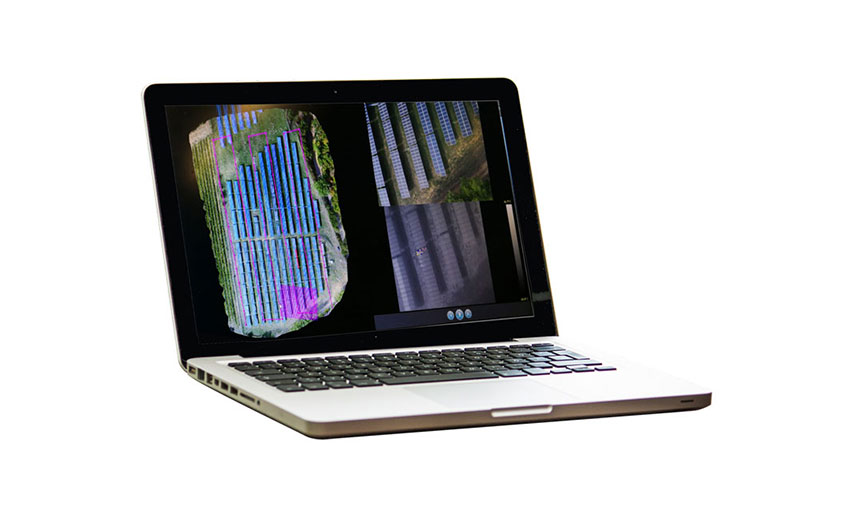
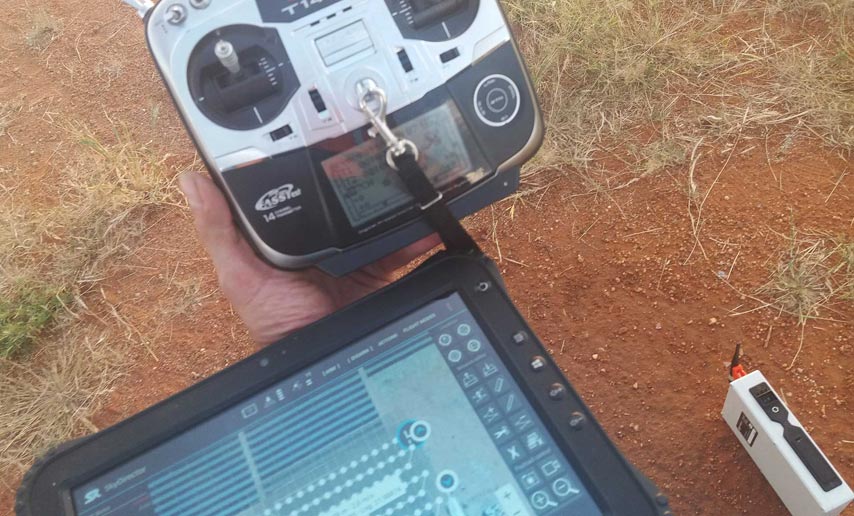
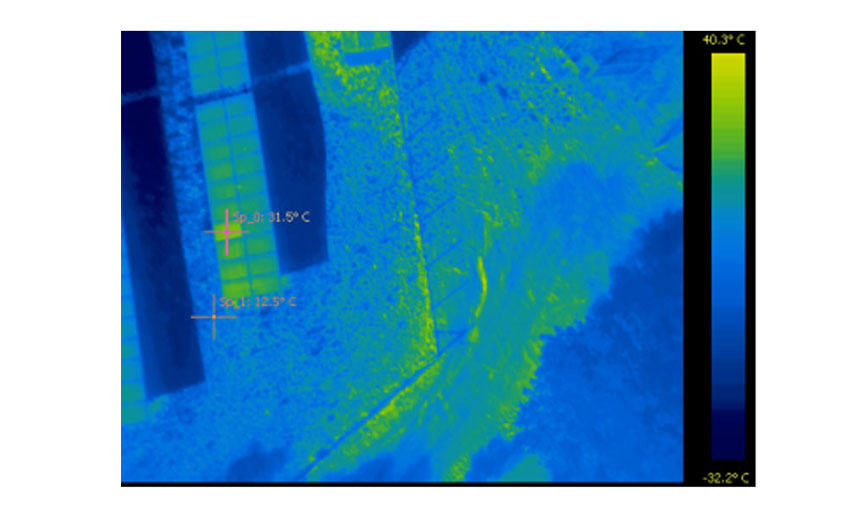
PV Inspector, integrating with remote piloted aerial systems (drones) and with hi-tech sensors for visual and thermographic detection, allows surveys and inspections on large photovoltaic systems, reducing data capture and processing times.
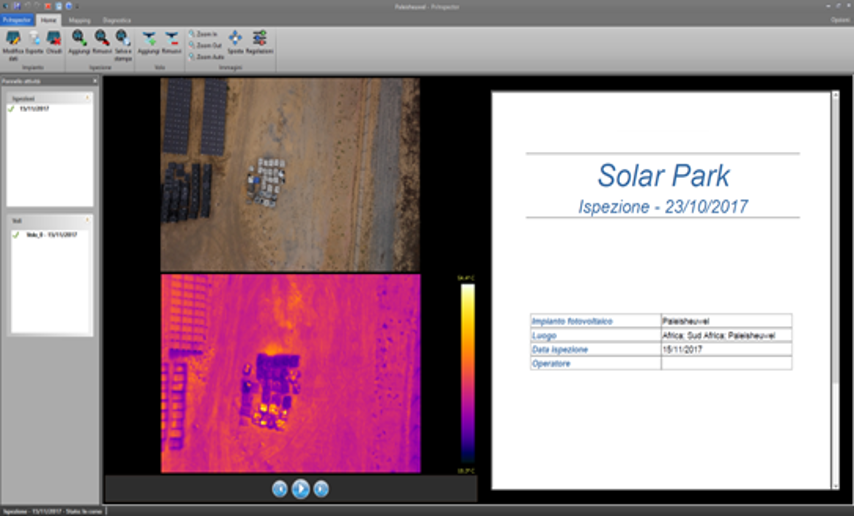
The imaging analysis software solution returns – in fact – digital data that highlights the criticality of the plants, such as hotspots, malfunctioning or underperforming panels and strings; accurately determines the location of the panels in the system; it allows to graphically annotate the acquired images to highlight the anomalies found, to add textual notes and finally to automatically produce an inspection report which includes the descriptions of the anomalies detected.
PV INSPECTOR WEB
The portal allows the use via WEB, for each customer, of the results and main data of the visible and thermographic inspections, the information acquired during the inspection and the results of the processing performed on the images themselves.
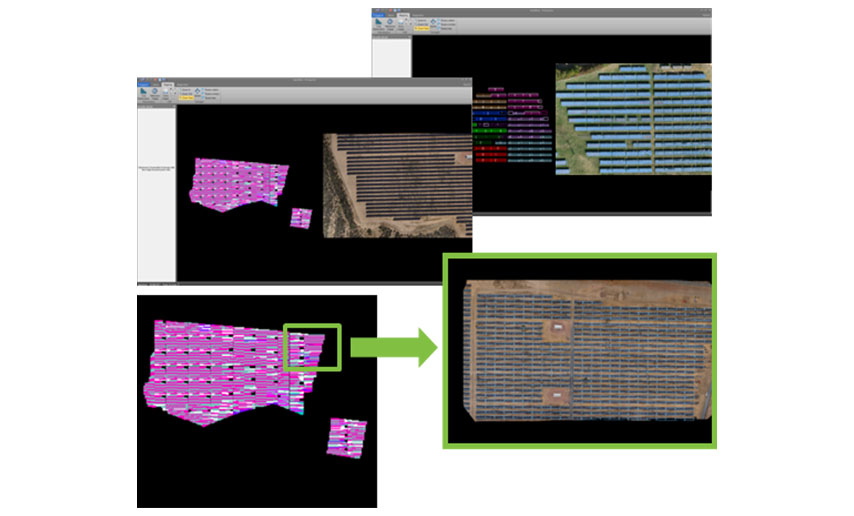
Using an infrastructure based on georeferenced representations, the operator can, for each plant, view:
- an aerial map of the system with the superimposition of a layer that reproduces the structure of the system itself derived from the system electrical diagram for the identification of individual elements (panels and strings)
- a section containing the estimates of production loss, both in terms of power and economic, resulting from the presence of the anomalies found
- a section for the analysis of individual anomalies
The map assumes significant importance as it allows, by selecting an anomaly or choosing the severity level, to view the position of the panels / strings affected by them.

In addition, for the single anomaly it is possible to view the images of the plant section acquired by the drone and the related screenshots produced with the desktop application to identify it.
Another main function made available by the application is that of the historical analysis of the results of surveys on the same system and its components.
In this way, by analyzing the history of the individual elements, areas subjected to abnormal stress that leads to breakdowns can be identified in advance and, consequently, “targeted” interventions can be carried out to solve the problem at the root.
The service, which can also be carried out on problematic and urbanized areas, allows the prevention and detection of plant failures, increasing the economic efficiency of O&M services, the financial performance of the same plants and reducing the time required to carry out operations.


Drone Dji Matrice 210 V2
GENERAL INFORMATIONS
M210 V2:
| Dimensions | Open, propellers and landing gear included, 883 × 886 × 398 mm
Folded, excluding propellers and landing gear, 722 × 282 × 242 mm |
| Diagonal wheelbase | 643 mm |
| Weight | approx.4.8 kg (with two TB55 batteries) |
| Maximum take-off weight | 6.14 kg |
| Load capacity | 1.34 kg |
Sensors and Camera

GENERAL INFORMATION: Type of instrumentation and Model
| SAPR | DJI Matrix210 V2 |
| VISUAL Camera | DJI Zenmuse XT2 4000×3000 30hz 8mm / Detail resolution 9.3 mm |
| THERMOGRAPHIC Camera | DJI Zenmuse XT2 640×512 30hz 19mm / Detail resolution 31.3 mm |
We guarantee an image resolution with optimal altitude flight * equal to:
* identified by the analysis of statistical data collected with missions carried out with different parameters: flight altitude, duration of the mission, terrain resolution.